Hi Friends,
Most of the time we have a requirement to configure MAP Viewer and it's not straight forward. Here, by using a simple code we can at least implement a simple USA map. Let's move to example to make things more clearer.
OBIEE Versions -> OBIEE 11.9 & OBIEE 12c .
Required Data:
1. 1 Attribute column which has all the US states names (MANDATORY!!!!)
2. 1 Metric Column.
I have prepared a excel sheet where it has 2 column named States and Revenue.
Sheet attached:
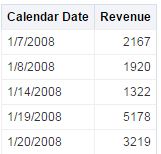
My final table will look like:
NOTE: Here I have removed comma (,) and desimal (.) from column properties in Revenue Column.
Now open Narrative view paste below code:
Source from Google Gallery:
https://developers.google.com/chart/interactive/docs/gallery/geochart
Code which I modified:
Then final outcome will be:
We can change its dimension by its :
We can change its color:


