Sometimes we have a requirement to show certain metrics for a single day. For this calendar chart is the best example and YES we can create in OBIEE too.
OBIEE Versions -> OBIEE 11.9 & OBIEE 12c.
Required Data:
1.Date dimension with MM/DD/YYYY format
2.One aggregate column
RPD and Catalog
I have used the default “Sample App Lite Data” that comes with the default obiee installation.
Implementation Steps

Code which I modified :https://drive.google.com/open?id=1SVxDWJFCI9kS2Mr2zLxB0voHqvn1xQZM
NOTE
1.Contain HTML Markup should be tick marked.
2. Rows to display should be 250 or 365 based on our data.
4.Once we clicked done .We will get below:
Here we have a scale of 0-23000 that denotes the maximum value in Revenue Column. If we click any cell if will give us the revenue wrt its date as shown below:
As I clicked on a cell it shows its data i.e Revenue is 20732 on July 16,2008.
I hope that you have enjoyed this blog. In case of any suggestion, you guys are heartily welcome.
OBIEE Versions -> OBIEE 11.9 & OBIEE 12c.
Required Data:
1.Date dimension with MM/DD/YYYY format
2.One aggregate column
RPD and Catalog
I have used the default “Sample App Lite Data” that comes with the default obiee installation.
Implementation Steps
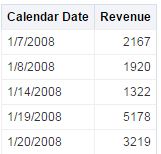
1.Drag and drop “Calender Date” from Time and “Revenue” from Base Fact from Subject Area as “Sample Sales Lite”
2. Remove commas, $ sign etc. from Revenue column. It should be whole numbered.

3.Open Narrative view and paste the code as shown below.
Calender chart code is taken from - https://developers.google.com/chart/interactive/docs/gallery/calendarCode which I modified :https://drive.google.com/open?id=1SVxDWJFCI9kS2Mr2zLxB0voHqvn1xQZM
NOTE
1.Contain HTML Markup should be tick marked.
2. Rows to display should be 250 or 365 based on our data.
4.Once we clicked done .We will get below:

As I clicked on a cell it shows its data i.e Revenue is 20732 on July 16,2008.
I hope that you have enjoyed this blog. In case of any suggestion, you guys are heartily welcome.


